DESCRIPTION
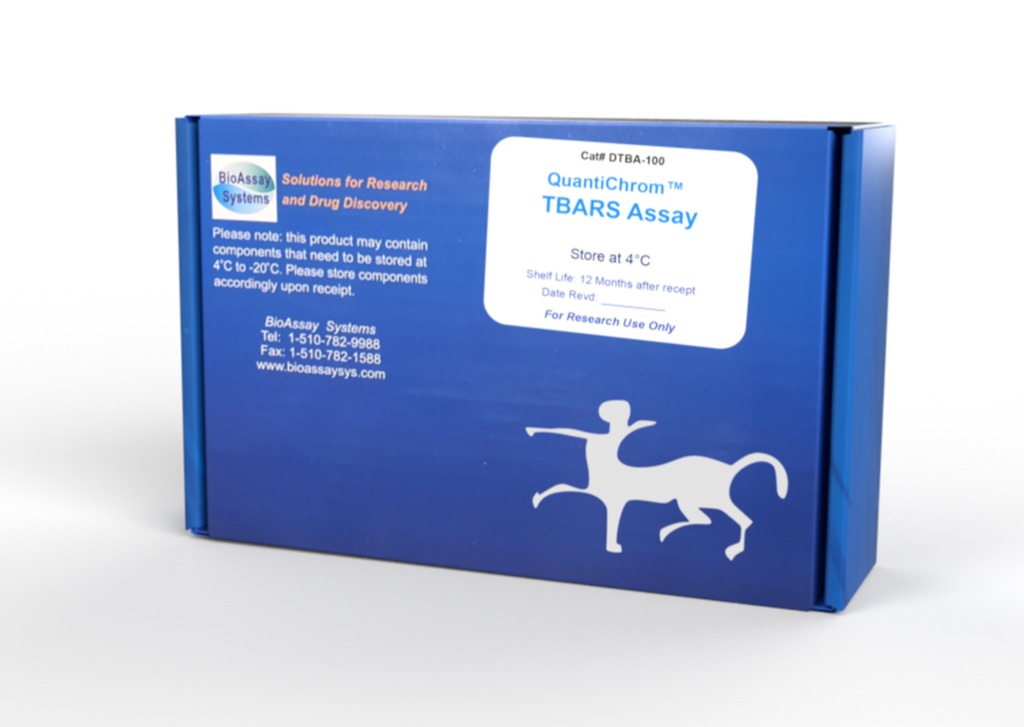
Oxidative attack of essential cell components by reactive oxygen species has been associated with several human diseases, such as atherosclerosis, cardiovascular diseases, diabetes, liver disorders, and inflammatory rheumatic diseases. THIOBARBITURIC ACID REACTIVE SUBSTANCES (TBARS) are low-molecular-weight end products (mainly malondialdehyde, MDA) that are formed during the decomposition of lipid peroxidation products. Increased levels of TBARS have been demonstrated in these diseases. Simple, direct and accurate assays for TBARS find wide applications in research and drug discovery. BioAssay Systems' TBARS assay is based on the reaction of TBARS with thiobarbituric acid (TBA) to form a pink colored product. The color intensity at 535 nm or fluorescence intensity at (λex/em = 530 nm / 550 nm) is directly proportional to TBARS concentration in the sample.
KEY FEATURES
Sensitive and accurate. Linear detection range: colorimetric assay 1 - 30 µM, fluorometric assay 0.1 - 1.5 µM MDA.
APPLICATIONS
Direct Assays: serum, plasma, urine, saliva and other biological samples.
Drug Discovery/Pharmacology: effects of drugs on TBARS.
KIT CONTENTS
TBA Reagent: 25 mL Standard: 50 µL 6 M MDA
10% Trichloroacetic acid (TCA): 25 mL
Storage conditions: The kit is shipped at room temperature. Store all components at -20 °C. Shelf life of six months after receipt.
Precautions: reagents are for research use only. Normal precautions for laboratory reagents should be exercised while using the reagents. Please refer to Material Safety Data Sheet for detailed information.
SAMPLE PREPARATION
Samples can be kept frozen at -80°C (stable for one month) if not assayed immediately. Urine samples are stable at 25˚C or below for at least 3 days. Urine and saliva samples can be assayed directly (n = 1). The following samples need to be deproteinated prior to assay:
1. For serum and plasma, transfer 100 μL of each sample into a labeled 1.5-mL tube. For tissue samples, weigh ~20 mg into 200 μL ice-cold phosphate buffered saline (PBS). Homogenize tissue by brief sonication (e.g. 20 seconds) on ice. If desired, remove 20 μL aliquot for protein analysis. Place 100 μL tissue lysate into a labeled 1.5 mL microcentrifuge tube. For cells, harvest 5 x 10⁶ cells in 200 μL ice-cold PBS and sonicate to disrupt cells. If desired, remove 20 μL aliquot for protein analysis. Place 100 μL cell lysate into a labeled 1.5 mL micro-centrifuge tube.
2. Add 200 μL ice cold 10% TCA to the 100 μL of each sample. Incubate for 5 minutes on ice.
3. Centrifuge 5 min at 14,000 rpm in an Eppendorf Centrifuge. Transfer 200 μL of each clear supernatant into a new labeled tube. Dilution factor for these pretreated samples is n = 3.
COLORIMETRIC ASSAY PROCEDURE
Set up water bath or heat block and adjust the temperature to 100°C. Equilibrate all components to room temperature.
1. Standards. First, briefly centrifuge the Standard tube to pellet any MDA that may be stuck in the cap or on the sides of the tube. Then mix 4 µL of the 6 M MDA with 2396 µL dH2O (final 10 mM MDA). Next, prepare 30 µM MDA by mixing 3 µL of the 10 mM MDA with 997 µL dH2O. Dilute standards as shown in the Table.
Transfer 200 µL of each standard into separate, labeled 1.5-mL screw cap tubes. Samples. Transfer 200 µL of each sample into separate tubes.
2. Color reaction. To each of the standards and samples, add 200 µL TBA Reagent. Vortex tubes to mix and incubate at 100°C for 60 min. Cool down tubes to room temperature. Vortex and briefly centrifuge tubes.
3. Load 100 µL in duplicate from each tube to wells of a clear flat-bottom 96-well plate. Read OD at 535 nm (525 to 545 nm).
FLUORIMETRIC ASSAY PROCEDURE
The fluorescence assay is 20 times more sensitive than the colorimetric assay.
1. Prepare the standards as described in the Colorimetric Assay Procedure. Transfer 10 μL of each Standard into labeled tubes. Add 190 μL dH2O (final concentrations 0, 0.45, 0.90, 1.50 µM MDA ) . Samples. In separate tubes, add 200 µL of treated samples.
2. Add 200 μL TBA Reagent. Vortex tubes to mix and incubate at 100°C for 60 min. Cool down tubes to room temperature. Vortex and briefly centrifuge tubes.
3. Load 100 µL in duplicate from each tube to wells of a black flat-bottom 96-well plate. Read fluorescence intensity (λex/em = 530 nm/550 nm) on a plate reader.
CALCULATION
Subtract blank OD or fluorescence intensity value (#4) from all standard and sample values. Plot the ∆OD535nm or ∆F against standard concentrations and determine the slope of the standard curve. Calculate the TBARS concentration of Sample,
RSAMPLE and RBLANK are the OD535nm or fluorescence intensity values of the sample and H2O blank (standard #4). n is the sample dilution factor (n = 3 for deproteinated samples).
Note: if calculated TBARS concentration is higher than 30 µM MDA (colorimetric assay) or 1.5 µM MDA (fluorometric assay) , dilute sample in dH2O and repeat assay. Multiply the results by the dilution factor.
MATERIALS REQUIRED, BUT NOT PROVIDED
Pipetting devices, centrifuge tubes, centrifuge, clear flat-bottom uncoated 96-well plates, optical density or fluorescence plate readers, sonicator, water-bath or heat block.
PUBLICATIONS
1. Paul, S., et al. (2021). D4F prophylaxis enables redox and energy homeostasis while preventing inflammation during hypoxia exposure. Biomedicine & Pharmacotherapy. 133: 111083.
2. Liang, K., et al. (2020). Effect of storage on n-3 PUFA-enriched eggs. CyTA - Journal of Food. 18(1): 102-107.
3. Nawab, A., et al. (2019). Effect of dietary curcumin on the antioxidant
status of laying hens under high- temperature condition. Journal of
Thermal Biology. 86: 102449.
